
Goldback 2025 Recap: Growth by the Numbers
2025 was a defining year for Goldback. We launched new state series, saw a record expansion of the network, and felt a huge increase in real-world use. The data is in, and it confirms Goldbacks are gaining traction as a practical alternative currency.
Here’s what the numbers tell us about how we grew from 2024 to 2025!
Record Growth in New Goldback States

Last year, many new series were added to the Goldback lineup, bringing gold currency to more people and places. New releases included:
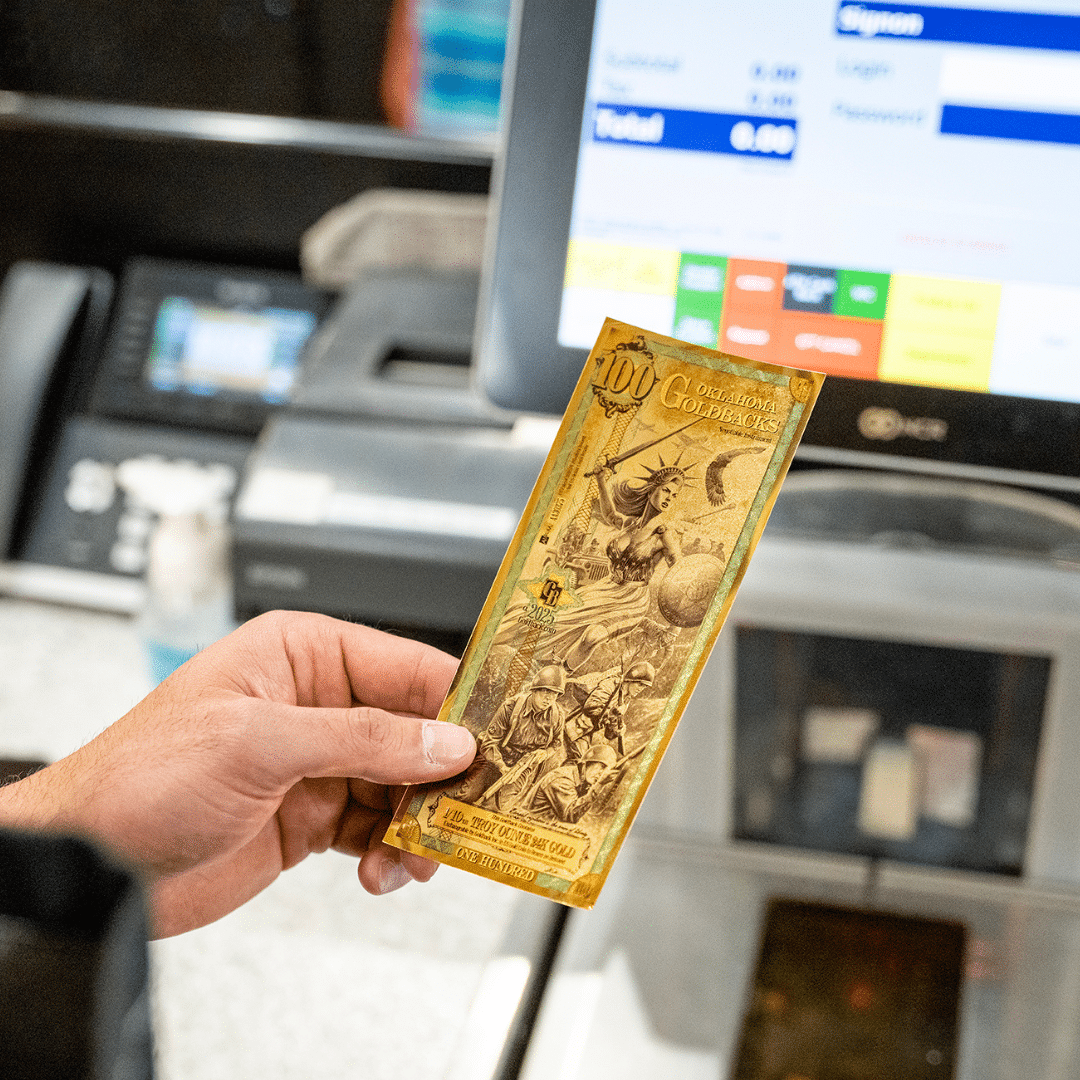
- Full state series for Florida, Oklahoma, and Arizona
- A limited city-based release in Dallas, Texas
By the end of 2024, we had five full state series. These launches in 2025 brought that number to eight!
Goldback Network Expansion
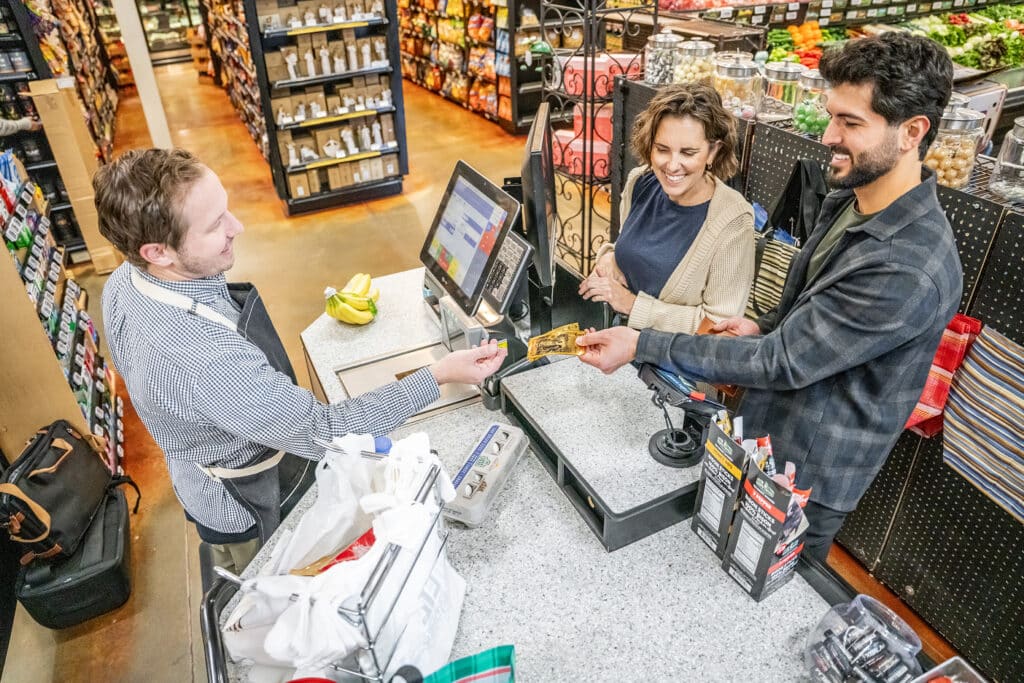
A large signal of adoption last year came from businesses’ participation. In 2025, both the merchant and distributor networks saw substantial growth!
Merchant Network
- Merchants at the start of 2025: 1,902
- Merchants at the end of 2025: 3,581
- Total growth: +88%
Distributor Network
- Distributors at start of 2025: 167
- Distributors at the end of 2025: 420
- Total growth: +151%
Thousands of businesses are actively choosing to accept or exchange Goldbacks in real-world transactions, making Goldbacks more accessible and easier to spend. Our small business network in the United States is now over 50% bigger than Bitcoin’s. This adoption cements Goldbacks’ role as a trustworthy currency.
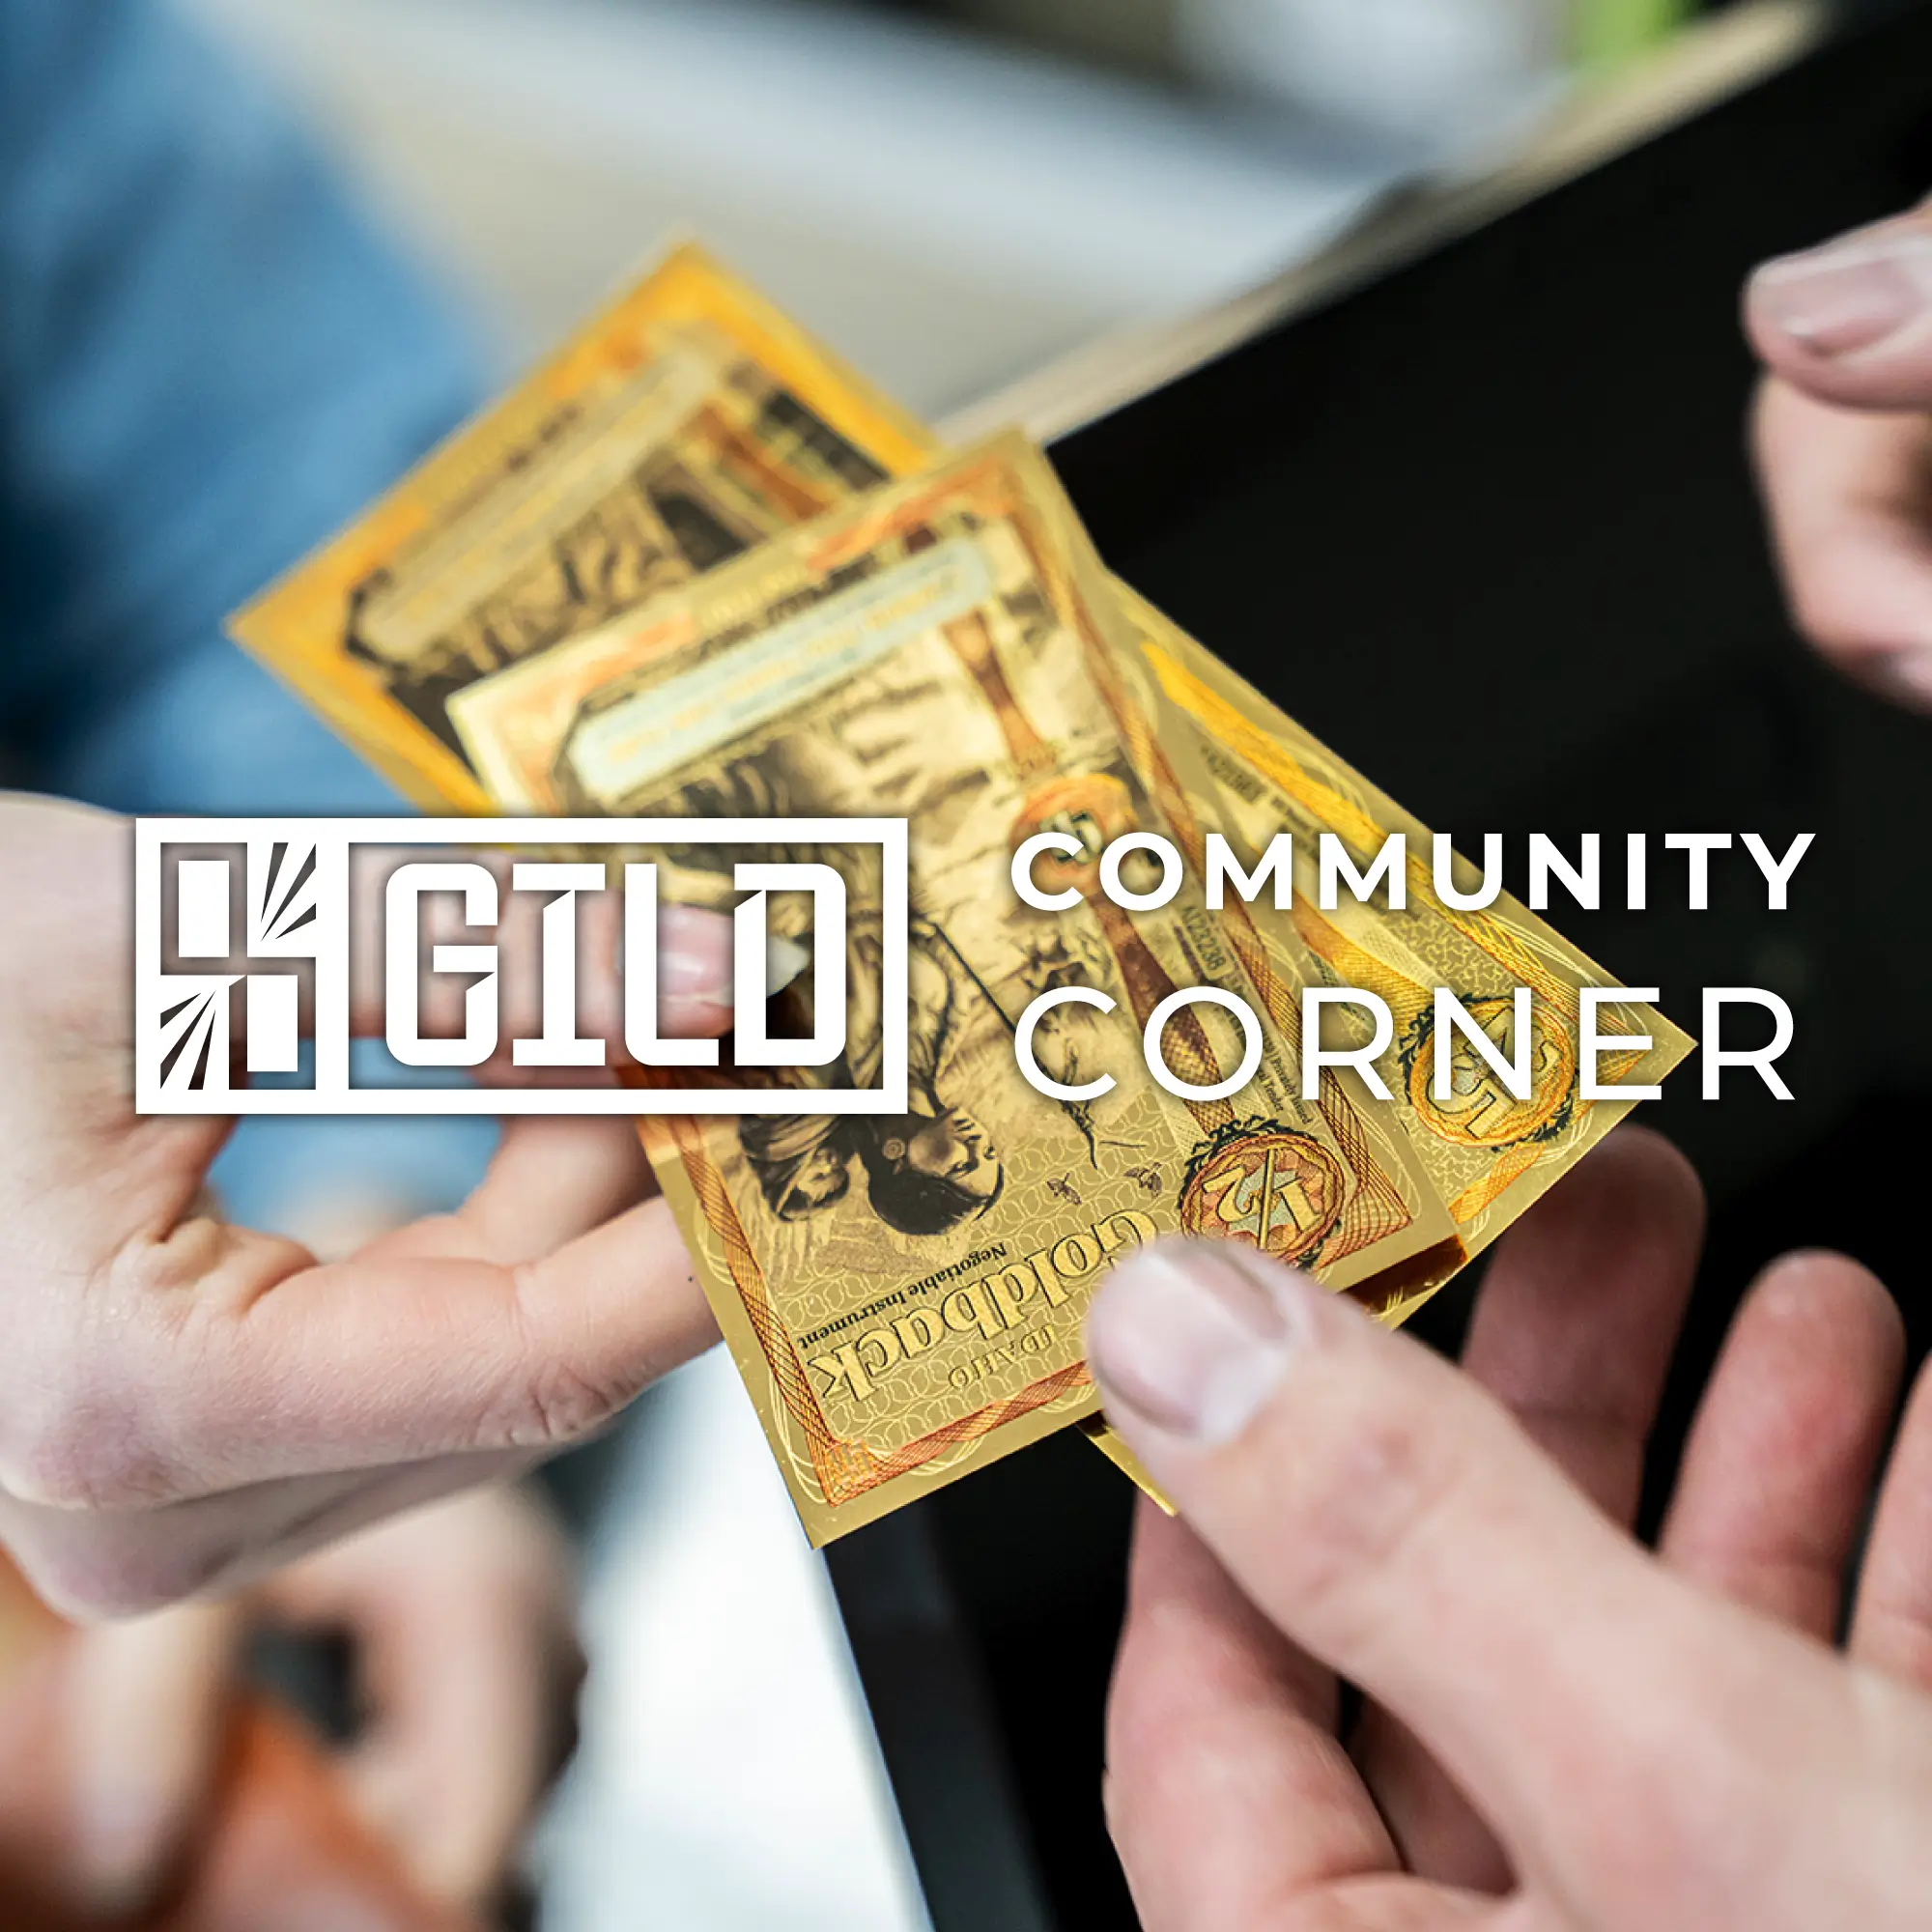
Community Growth Through GILD

In 2025, we launched the Goldback Interchange & Local Development (GILD)—a program designed to create communities around the world where Goldbacks are actively being used and exchanged. Here’s the progress we saw last year:
- 577 GILD members joined
- 11 GILD chapters were formed
- Official GILD members in all 50 states
These numbers represent real grassroots efforts. People are organizing locally, educating others, and helping Goldbacks function as currency within their own communities.
Rising Digital Engagement
As the network expanded, engagement followed. Not only is there growing interest in Goldbacks, but there is a growing number of real transactions. More people learned about Goldbacks, calculated real exchanges, and used the app to transact.
Website Traffic in 2024 vs. 2025
2024
- Unique website visits: 670,000
- Total website sessions: 840,000
- “Where to Buy” page visits: 340,000
- “Where to Spend” page visits: 458,000
- Total pageviews: 1.7 million
2025
- Unique website visits: 810,000 (20.9% YoY increase)
- Total website sessions: 1.53 million (82.1% YoY increase)
- “Where to Buy”” page visits: 608,000 (78.8% YoY increase)
- “Where to Spend” page visits: 900,000 (96.5% YoY increase)
- Total pageviews: 3.454 million (103% YoY increase)
App Downloads in 2025
- Total downloads: 14,000 across iOS and Android

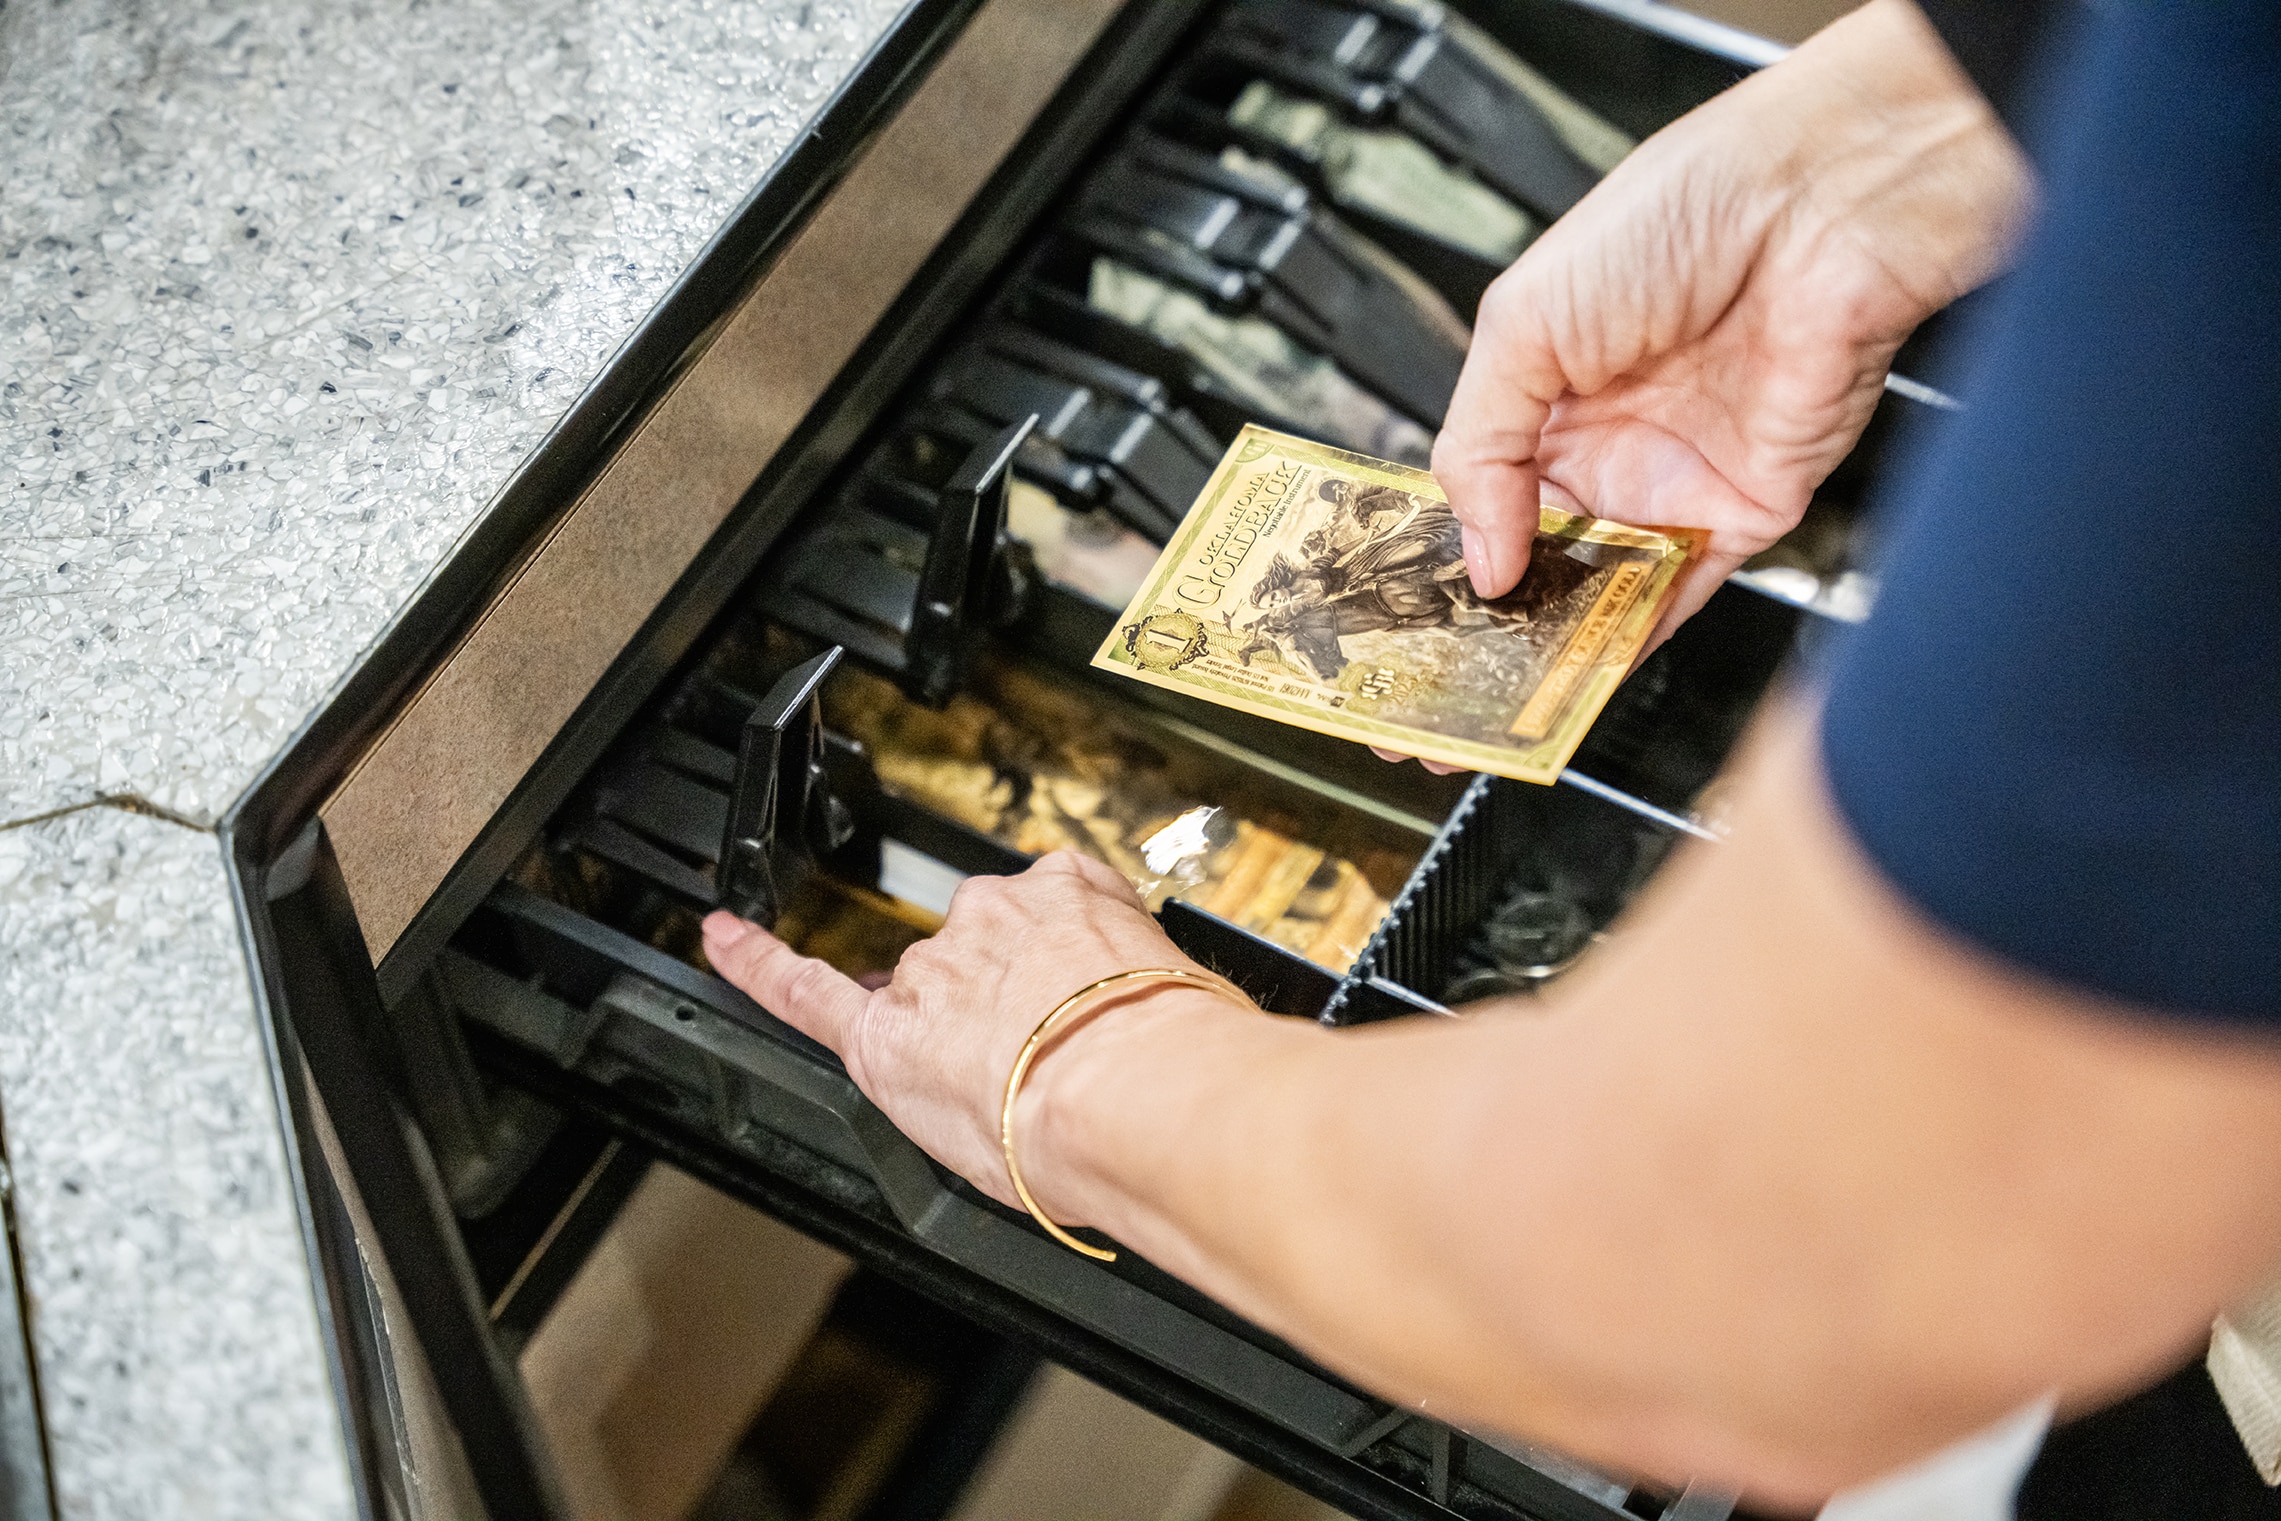
Total Value of All Goldbacks Produced
With increased adoption comes increased circulation.
- Total value at the end of 2024: $177 million
- Total value at the end of 2025: $331 million
Why 2025 Mattered
The numbers make one thing clear: Goldback adoption in the real world appears to be growing exponentially.
More merchants are accepting them. More people are spending them. More communities are choosing gold as a practical form of money. We’re excited to see the Goldback starting to gain so much traction!
Thank you to everyone who used Goldbacks, introduced a business, supported a new series, or helped grow the Goldback economy. We can’t wait to keep building together in 2026!
Related Articles
GILD Community Corner: Record Growth in the First Half of 2026!
The Goldback community continues to grow in new …

84 New Businesses Joined the Merchant Network Last Week!
The following businesses joined the Goldback Merchant Network …
What Is a Gold-Backed Currency? A Complete Guide
By Seth Light | Reviewed June 2026 A …
Meet the 25 New Merchants Who Joined the Network Last Week!
The following businesses joined the Goldback Merchant Network …